🕑 Einstein Special Relativity Debunked for Beginners 🕙 |

|
|
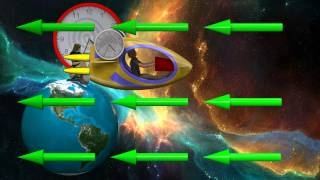
The Clock Paradox (Twin Paradox) and Spherical Wave Proof mathematics are used to show how Special Relativity falls apart. The idea is to use Einstein's own words and check his mathematics in order to disprove Special Relativity.
0:00 Why Worry About Relativity? 1:44 How Can Relativity Be Wrong? 4:09 Wave Medium Doppler Effect 5:20 Wave-Particle Duality 5:58 Reference Frames 8:31 Clock Paradox Explanation 16:42 Spherical Wave Proof Explanation 18:20 Spherical Wave Proof Demo 21:55 Simultaneity Animation Demos #science #Einstein #timedilation #TheoryofRelativity Links: Special Relativity Animations (used at the end of the video): https://physics.nyu.edu/~ts2/Animation/special_relativity.html# Einstein's "Special Relativity Paper" (1905): https://einsteinpapers.press.princeton.edu/vol2-trans/154 Einstein's "Dialogue about Objections to the Theory of Relativity" (1918): https://einsteinpapers.press.princeton.edu/vol7-trans/82 Einstein's "Photoelectric Effect" Paper (1905): https://einsteinpapers.press.princeton.edu/vol2-trans/100 If you want hands-on experience with the Spherical Wave Proof, then you can go to the link below and utilize this Python code to help transform the spherical wave coordinates: https://www.online-python.com/yl146iFWAw You can modify the moving frame speed (0.0 speed will give you the stationary spherical wave), copy the resulting coordinates, and past them into the Desmos graphing calculator to see the resulting shape (https://www.desmos.com/calculator). --------------------------------------------------- Stationary Sphere Python Code: --------------------------------------------------- import numpy as np import matplotlib.pyplot as plt x = np.linspace(-5.0, 5.0) y = np.linspace(-5.0, 5.0) X, Y = np.meshgrid(x,y) # Graphing in terms of LightSeconds speedOfLight = 1 seconds = 1 # Stationary Spherical Wave stationaryFunction = X**2 + Y**2 - ((speedOfLight**2)*(seconds**2)) # Plot the function fig, ax = plt.subplots() ax.contour(X,Y,stationaryFunction,[0]) ax.set_aspect(1) plt.title('Stationary Observer Light Sphere', fontsize=8) plt.xlim(-3,3) plt.ylim(-3,3) plt.grid(linestyle='-') plt.show() ----------------------------------------------- Moving Sphere Python Code: ----------------------------------------------- import numpy as np import math import matplotlib.pyplot as plt x = np.linspace(-3.0, 3.0) y = np.linspace(-3.0, 3.0) X, Y = np.meshgrid(x,y) # This is the moving reference frame speed, based on percentage of the speed of light movingVelocity = 0.75 # Graphing in terms of Light Seconds speedOfLight = 1.0 seconds = 1.0 # Lorentz Factor or Beta from the Relativity Paper gammaFactor = 1/math.sqrt( 1-(movingVelocity**2 / speedOfLight**2) ) # Moving Frame Time Transform or Tau tauRadius = (gammaFactor * (seconds - ((movingVelocity*X) / speedOfLight**2))) # Moving Frame X Transform or Xi movingX = gammaFactor * (X - (movingVelocity*seconds) ) # Moving Frame Transform Equation movingFunction = movingX**2 + Y**2 - (speedOfLight**2 * tauRadius**2) # Plot the Moving Function (X coordinate is shifted over by number of LightSeconds) fig, ax = plt.subplots() ax.contour(movingX,Y,movingFunction,[0]) ax.set_aspect(1) plt.title('Moving Observer Light Sphere', fontsize=8) plt.xlim(-3,3) plt.ylim(-3,3) plt.grid(linestyle='-') plt.show() ------------------------------------------------------------------------------ Moving Sphere Point Plotting Python Code for DESMOS: ------------------------------------------------------------------------------ import math import numpy as np # Moving Frame Velocity in terms of percentage of the speed of light movingVelocity = 0.98 # LightSeconds (Speed of light = 1 for each second) speedOfLight = 1.0 seconds = 1 # Lorentz Factor Equation or Beta from the Einstein Paper gammaFactor = 1/math.sqrt( 1-(movingVelocity**2 / speedOfLight**2) ) # Build a list of 100 values for the Y-Axis to plug into the Einstein transform equations yList = np.linspace(-seconds, seconds, num=100) # Get all 100 answers to the transform equations for Xi and Tau. for yAxis in yList: xAxis = math.sqrt((speedOfLight**2 * seconds**2)-(yAxis**2)) xi = gammaFactor*(xAxis - (movingVelocity*seconds)) tauRadius = gammaFactor*(seconds - ((movingVelocity*xAxis) / speedOfLight**2)) # Print all the Moving Coordinates print(xi, "," , yAxis) #print(tauRadius) |