How To Read Stock Charts: Moving Averages |

|
|
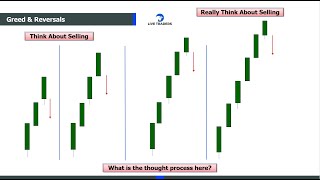
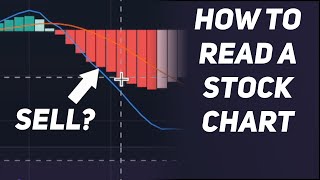
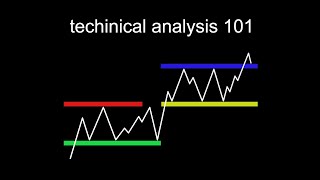
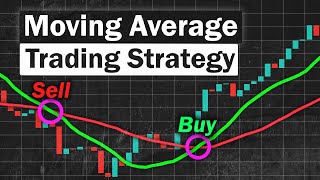
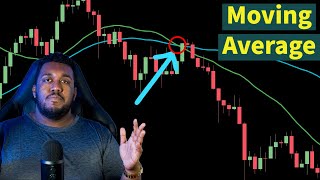
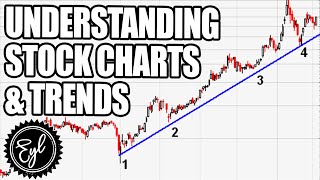
Moving averages are a crucial component of how to read stock charts. We'll show you how looking at these trend lines can cut through the noise of daily chart action and give you a clearer picture of what's happening.
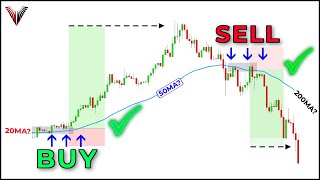
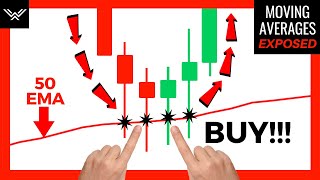
One handy way to figure out if a stock is on a roll is to look at its moving averages, which track the average closing share price over a certain period of time. Why look at these trend lines? Well, for one thing, they cut through the noise of daily chart action and can give you a clearer picture of what’s happening. The 50-day moving average is the red line on this chart. If it’s climbing upward, that means the stock is trending higher – always a good a sign. 200-day moving average: the average share price over the last 200 days of trading. It’s also a fine way to figure out where the big money is moving. Institutional investors often use the 50-day line as a reference point, buying more shares when a stock pulls back to the moving average. And when shares rebound higher off the key level as a result, we call that “finding support.” Why is that important? Because those brief pullbacks can lead to additional buying opportunities for individual investors like you. On the flip side, when a stock crumbles below a moving average in heavy volume, we call that “breaking support.” And when a stock has trouble getting back above that line, we call that “hitting resistance.” And that might mean that the big investors aren’t as interested in the stock as they used to be. As always, make sure you’re keeping an eye on volume, because that’s how you know just how aggressively fund managers and other major players are moving into or out of a stock. Learning how to invest in stocks is an important first step to building wealth. But where do you start? How do you buy stocks? How do you know when to sell stocks? Do you really need to know how to read stock charts? You'll find the answers to all those questions as we continue to add new How To Invest videos to this page. How To Start Investing In Stocks: Before you start investing in stocks, it's important to learn how the stock market works and understand some basic rules about how to buy stocks and when to sell stocks. At Investor's Business Daily, you'll find a time-tested investing strategy known as the CAN SLIM Investing System. Developed from our unique study of every market cycle since the 1880s, the CAN SLIM system identifies the seven common traits of winning stocks. And the videos below will show you how to apply various aspects of the CAN SLIM strategy. Be sure to subscribe and keep coming back, as we'll be adding new How To Invest videos on chart patterns, buying and selling and more topics in the days and weeks ahead. Investor’s Business Daily has been helping people invest smarter results by providing exclusive stock lists, investing data, stock market research, education and the latest financial and business news to help investors make more money in the stock market. Learn more. Get more IBD by subscribing to our channel. Like us on Facebook https://business.facebook.com/investorsbusinessdaily Follow us on Twitter https://twitter.com/IBDinvestors Follow us on Instagram https://www.instagram.com/investorsbusinessdaily Follow us on StockTwits http://stocktwits.com/InvestorsBusinessDaily |


![BEST MACD Trading Strategy [86% Win Rate]](https://ytimg.googleusercontent.com/vi/rf_EQvubKlk/mqdefault.jpg)